To address the challenge of representing gReactions with multiple substrates or products, the following rules are applied to the network edges:
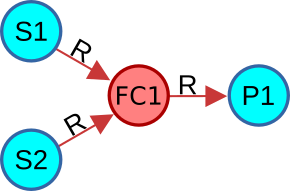
- Case 1: Multiple substrates, single product – A virtual intermediate compound is introduced, serving as an intermediary between the reaction’s multiple substrates and its final product. In the first phase, this virtual compound is generated by connecting all substrates, and in the second phase, it links to the actual reaction product.
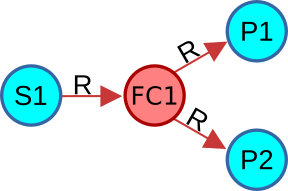
- Case 2: Single substrate, multiple products – A virtual compound is created and connected to the initial substrate, subsequently linking to all reaction products.
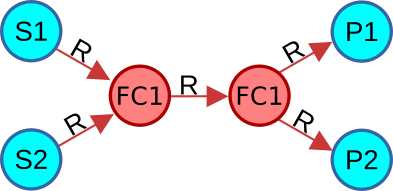
- Case 3: Multiple substrates and multiple products – Two virtual compounds are introduced: one connected to all substrates and the other to all products. These two intermediates are then linked, effectively creating an additional edge to maintain network continuity.
To ensure consistency, all newly generated edges retain the same name and reference as the original gReaction.
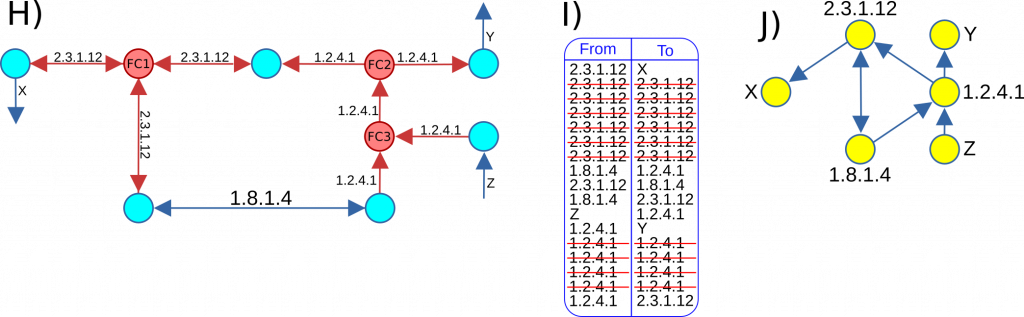
This process, illustrated in Figure H, may appear redundant; however, it is essential for streamlining the conversion of the primary graph G into its line graph L(G). Upon transformation, all redundant elements are systematically removed. Specifically, after generating L(G), the complete list of its edges is examined, and any instances where the origin and destination nodes are identical are eliminated. The refined version of L(G) is then reconstructed based on this optimized edge list, as demonstrated in Figures I and J.