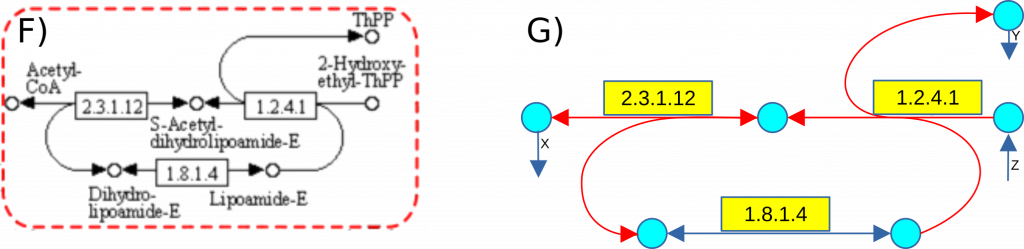
The KEGG database does not inherently support direct graph generation due to its use of bifurcated edges in certain pathway representations. To illustrate this challenge, we analyze another segment of the Glycolysis/Gluconeogenesis pathway (KEGG map 00010), as depicted in Figure F.
When a gReaction involves multiple substrates or products, it cannot be accurately represented using a single edge, as these interactions result in bifurcations within the network structure (Figure G). To address this issue and enable the construction of both the primary graph G and its corresponding line graph L(G), we decompose these complex reactions into a sequence of multiple virtual reactions, ensuring a structured and computationally manageable representation of metabolic pathways.