To enhance user accessibility and interaction, each KEGG pathway is initially transformed into a primary graph, denoted as G, and subsequently converted into its corresponding line graph L(G). This transformation is represented through an interactive HTML interface, enabling users to explore topological properties by hovering over individual nodes to reveal detailed information.
The interface facilitates the selection and highlighting of Articulation Points (APs) and non-Articulation Points (nAPs), allowing for the clear visual identification of critical nodes within the network. Additional features include zooming capabilities, node addition and removal, and the dynamic adjustment of the network layout and element positioning, providing a comprehensive and interactive analytical environment.
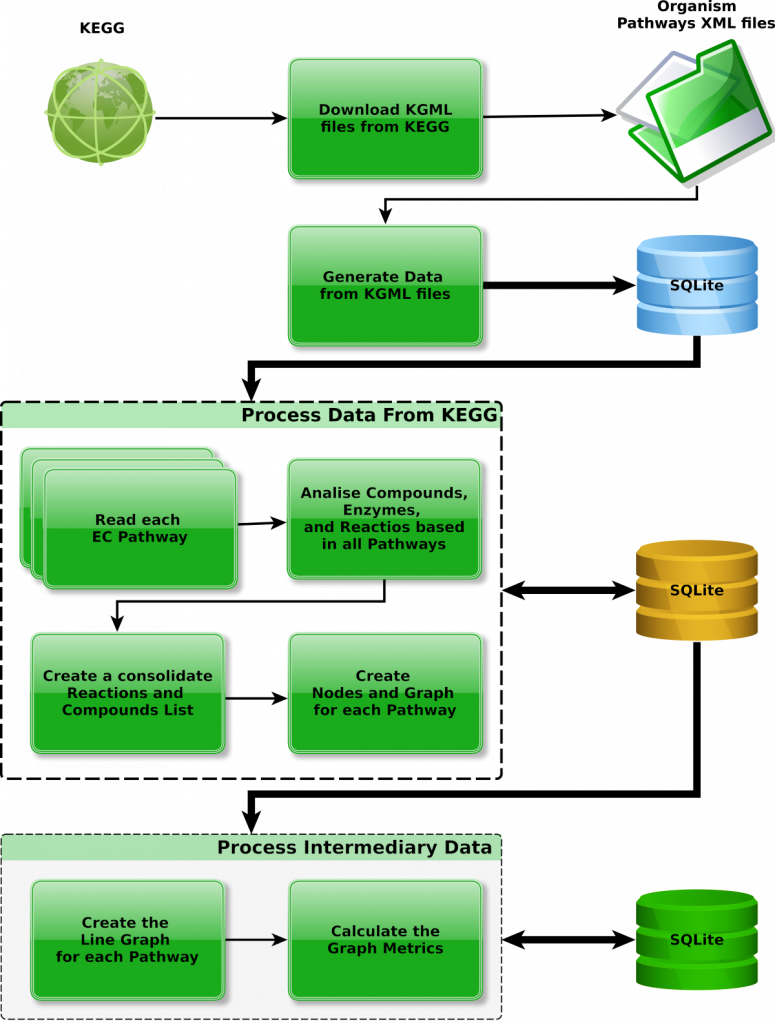
Our pipeline extracts pathway data from KEGG maps and systematically transforms it into a primary graph G, which is then converted into a line graph L(G). In this representation, nodes correspond to enzymes, while edges represent compounds involved in enzymatic reactions.
The pipeline computes various graph metrics based on L(G) and identifies Articulation Points—specific nodes whose removal results in network fragmentation. These nodes represent key vulnerabilities within metabolic pathways and may serve as critical control points in metabolic regulation.
The pipeline is segmented into four distinct and sequential phases, as outlined below.