To enhance the accuracy and clarity of the network representation, we introduce a new entity, called gReaction, which serves as the node in the primary graph G. The gReaction is defined by associating principal substrates and products, along with incorporating information regarding the reversibility of reactions. This approach ensures a more precise characterization of enzymatic activities within the metabolic network.
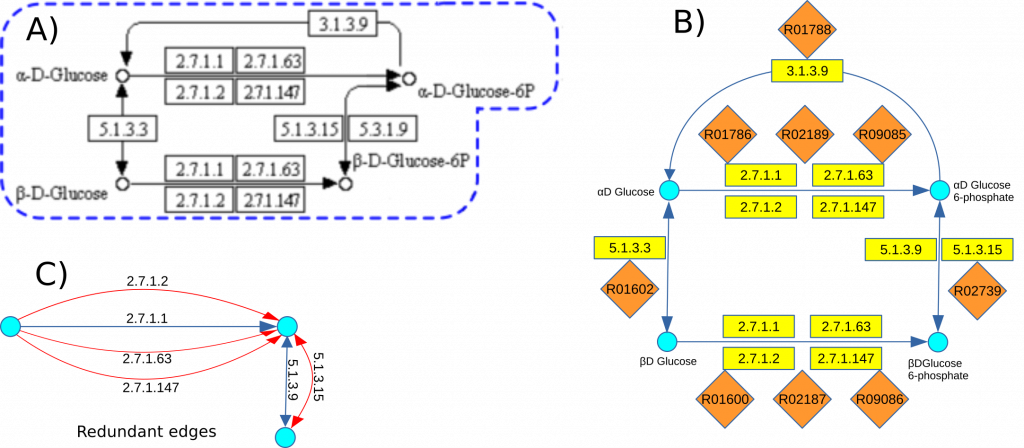
To illustrate this method, we examine a segment from the initial steps of the Glycolysis/Gluconeogenesis pathway (KEGG map 00010), focusing on substrates and products such as α-D-Glucose, α-D-Glucose 6P, β-D-Glucose, and β-D-Glucose 6P (Figure A). The schematic representation in Figure B highlights five distinct groups of reactions involved in this process:
- Four enzymes catalyzing three reactions to convert α-D-Glucose into α-D-Glucose 6P.
- The same four enzymes {2.7.1.1, 2.7.1.2, 2.7.1.63, 2.7.1.147} mediating three different reactions to convert β-D-Glucose into β-D-Glucose 6P.
- Two enzymes facilitating the interconversion reaction between α-D-Glucose 6P and β-D-Glucose 6P.
- Two additional reactions, each mediated by a single, distinct enzyme.
This pathway segment presents two primary challenges in the construction of graph G:
- Redundant edges (Figure C), resulting from multiple reactions that involve the same substrates and products but differ in auxiliary compounds or reaction conditions.
- Identical enzyme groups performing distinct functional roles within the pathway, complicating the differentiation of unique reaction pathways and their respective impacts on network topology.
Addressing these challenges is critical for generating an accurate and non-redundant graph representation that reflects the true biological complexity of the metabolic network.
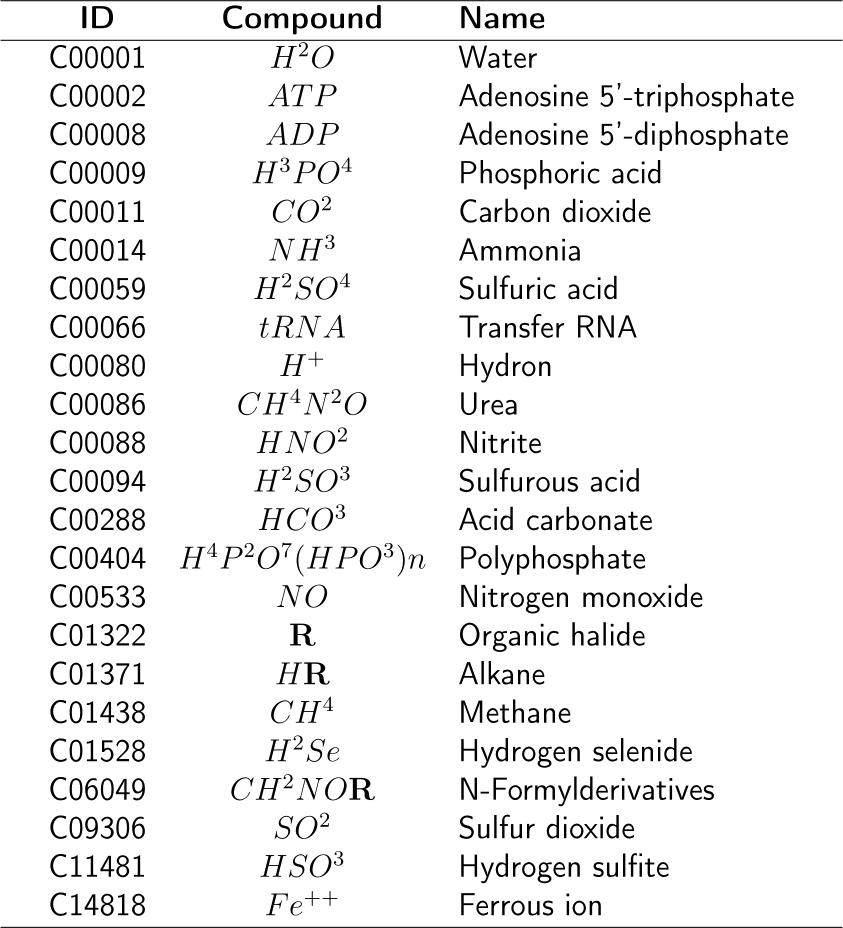
By excluding the secondary products listed in the table below, it is possible to consolidate and refine the grouping of similar enzymes. This approach reduces redundancy within the network representation, enabling a more accurate depiction of enzymatic relationships and functional similarities across reactions.